Loading last 10 games
Final 2025-26 regular season · Data through Apr 12, 2026
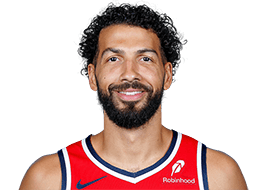
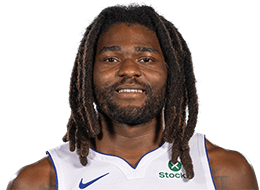
Anthony Gill
FGOx+7.2OVER EXPECTED+16.4 PTSOx
FG%Ox+10.2%FG% VS EXPECTED
FIELD GOAL EFFICIENCY
REAL FG%70.4%
EXPECTED FG%60.2%
Anthony Gill
FGOx+7.2OVER EXPECTED+16.4 PTSOx
FG%Ox+10.2%FG% VS EXPECTED
FIELD GOAL EFFICIENCY
REAL FG%70.4%
EXPECTED FG%60.2%
LAST 10 GAMES
12.3PPG
3.8RPG
2.0APG
0.8SPG
0.5BPG
70.4%FG%
53.8%3P%
72.7%FT%
76.2%TS%
31.0MPG
Achievements
last 10 games- 150-40-90 game
Last 10 games matchups
SHOT ZONES
Restricted Area
86.5%75.1% xFG%
32/37 madePaint (Non-RA)
47.4%47.1% xFG%
9/19 madeMid-Range
100.0%46.8% xFG%
2/2 madeLeft Corner 3
50.0%41.1% xFG%
2/4 madeAbove the Break 3
55.6%38.0% xFG%
5/9 madeRight Corner 3
—
0 attemptsSHOT MAP
Shots · 71
@ CLE · Apr 126/7 FG+1.2 FGOx
vs MIA · Apr 104/6 FG+0.3 FGOx
Difficulty = chance this player normally makes it1 / 5
Heat check verdict
model estimateLikely to cool off129° now → ~78° next
Shooting 10.2 percentage points above expected (70.4% FG on shots worth 60.2%). Over 71 shots about 19% of a gap like that tends to stick, so expect ~62.2% FG next.